Can an Excel-Based Data Analyst Move into AI?
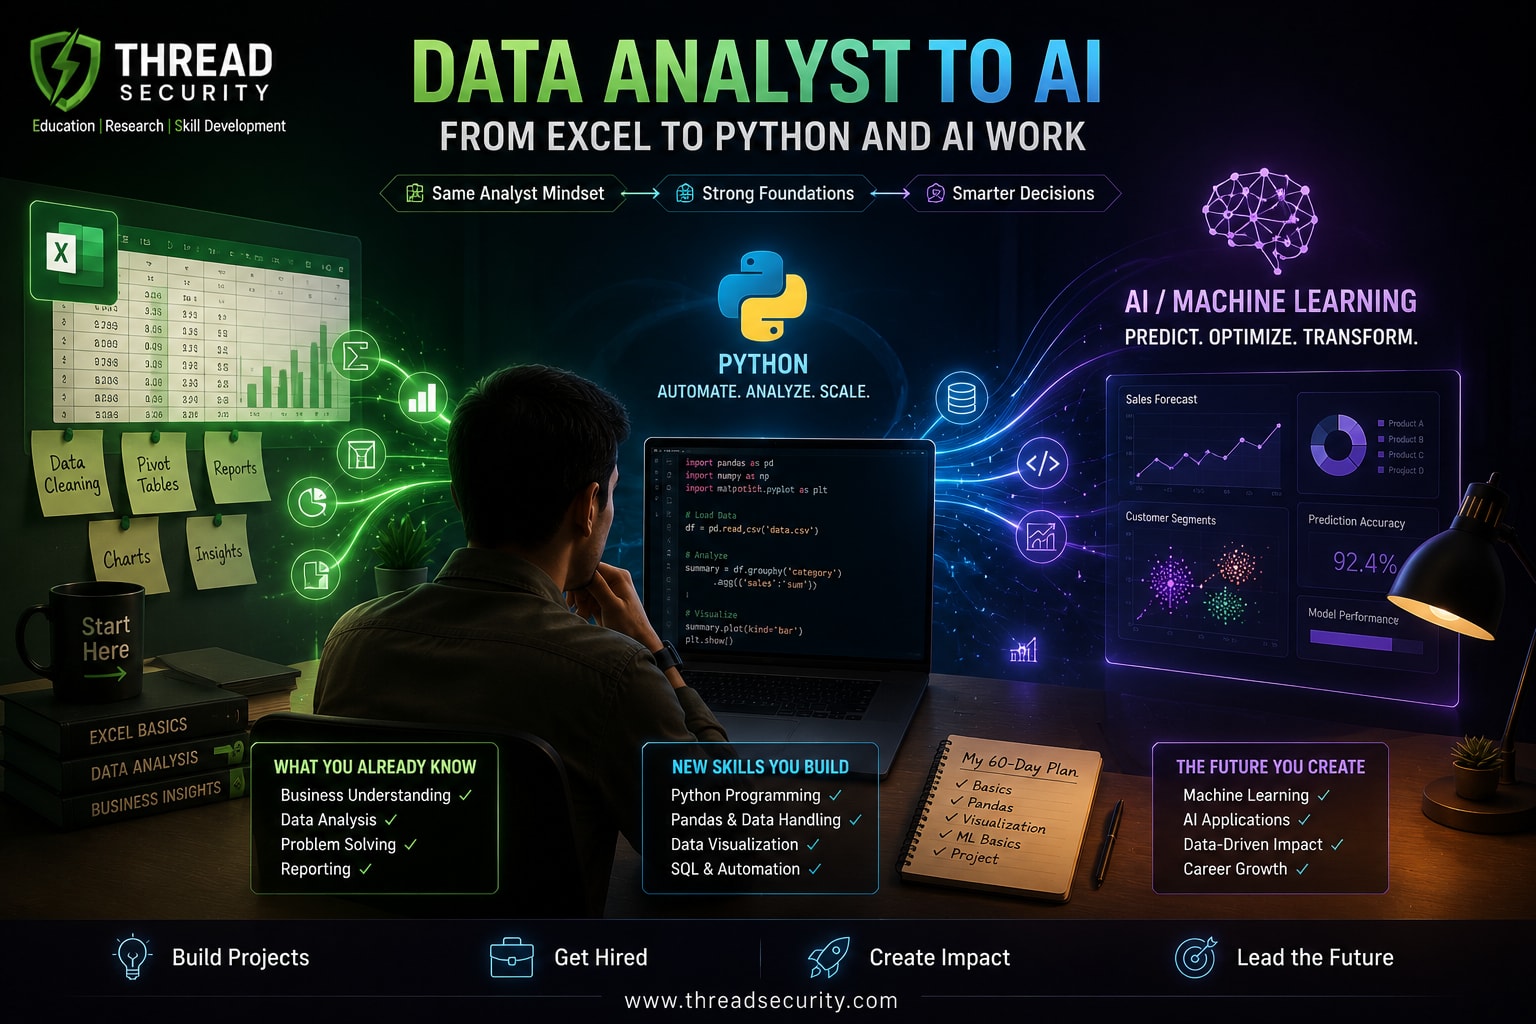
The journey from data analyst to AI professional may be easier than you think, especially if you already work with Excel. Your experience with spreadsheets, formulas, pivot tables, charts and business reports gives you a valuable starting point for learning Python, data analysis automation and machine learning.
Imagine taking the same sales spreadsheet you analyze manually and using Python to process thousands of records. You could automate calculations, create visualizations and eventually build a machine learning model to estimate future sales or identify patterns that are difficult to spot in a spreadsheet.
Moving from data analyst to AI work does not mean discarding your existing knowledge or starting with advanced neural networks. The practical approach is to build on your current skills, learn Python and pandas, understand data visualization, and gradually explore machine learning through projects.
1. Your Excel Skills Are More Useful Than You Think
Before learning another programming language, recognize what you already know. Data analysis involves asking useful questions, organizing information, checking data quality and communicating findings. These skills remain valuable whether you work in Excel, Python or an AI-powered analytics environment.
For example, if you regularly use Excel to calculate monthly revenue, compare product performance or identify unusual transactions, you already understand several important analytical tasks. Python helps you perform similar work more efficiently and repeat it across larger datasets.
Excel skill | Python equivalent | What you can do |
|---|---|---|
Formulas and calculations | Python expressions and functions | Automate calculations and reusable logic |
Sorting and filtering | pandas sorting and filtering | Process selected records programmatically |
VLOOKUP or XLOOKUP | pandas merge and join | Combine information from multiple datasets |
Pivot tables | groupby and pivot_table | Summarize data by categories |
Charts | Matplotlib and Seaborn | Create repeatable visualizations |
Conditional formatting | Filtering, rules and visualization | Highlight unusual values and patterns |
Repeated reports | Python scripts and notebooks | Build a reusable reporting workflow |
You do not need to master every Python feature before working with data. Focus first on the programming concepts that support your existing analytical tasks.
2. Learn Python Without Starting From Zero
Python is widely used in data analysis, automation and machine learning because it has a readable syntax and a large ecosystem of libraries. For someone moving from Excel, the goal is not to learn programming in isolation. It is to use programming to solve familiar problems in a new way.
Start with the essentials
Learn variables, strings, numbers, lists, dictionaries, conditions, loops, functions and basic file handling. Understand how to read a CSV file, transform values, handle missing information and save processed results.
For example, instead of manually calculating the total for a list of sales values, you can use a Python function. As your tasks become more complex, functions allow you to reuse logic rather than repeat the same steps.
Move quickly into pandas
pandas is a Python library designed for working with structured data. Its DataFrame structure is similar in spirit to a spreadsheet table: rows represent records, while columns represent variables.
Practice loading CSV and Excel files, inspecting column types, filtering records, removing duplicates, handling missing values, grouping data and joining tables. These operations connect directly to everyday spreadsheet work.
For instance, a sales analyst could load several monthly files, standardize their columns, combine them into one dataset and calculate revenue by region in a repeatable workflow.
Use notebooks to explore data
Jupyter Notebook allows you to combine code, output, charts and explanations in one document. This makes it useful for learning, experimentation and presenting analytical work. Google Colab is another option for browser-based notebook work when you want to get started without configuring a local Python environment.
Your first milestone should be simple: take a spreadsheet you understand, reproduce a few of its calculations in Python, and explain the results in your own words.
3. Build Data Visualization and Analytical Thinking
Moving towards AI does not mean skipping traditional data analysis. A model can produce misleading results when its input data is incomplete, inconsistent or poorly understood. Exploratory data analysis helps you examine a dataset before making conclusions or training a model.
Learn to answer questions such as:
How many rows and columns does the dataset contain?
Are there missing values, duplicate records or inconsistent categories?
Which variables have unusually high or low values?
How do sales, demand or customer activity change over time?
Are two variables associated, and could other factors explain that relationship?
Use Matplotlib or Seaborn to create bar charts, line charts, histograms, box plots and scatter plots. Choose each chart based on the question you want to answer, not simply because it looks attractive.
Also learn to distinguish correlation from causation. If sales and advertising expenditure rise together, that alone does not prove that advertising caused the entire increase. Seasonality, pricing, promotions and other variables may also contribute.
This analytical judgement is an important part of responsible AI work. Tools can speed up calculations, but you still need to evaluate whether an interpretation makes sense.
4. When Should You Start Machine Learning?
Once you can clean, explore and visualize a dataset using Python, begin learning the fundamentals of machine learning. You do not need to study every algorithm at once. Start with a small number of methods and understand the problems they are designed to solve.
Understand the main types of problems
Regression: Predicts a numerical value, such as expected sales or delivery time.
Classification: Predicts a category, such as whether a transaction may require fraud review.
Clustering: Groups similar records, such as customers with comparable purchasing behaviour.
With scikit-learn, you can learn to divide data into training and testing sets, establish a baseline, train a model and evaluate its performance. Begin with straightforward methods such as linear regression, logistic regression, decision trees and random forests.
Learn why a model that performs well on training data may fail on new records. This is known as overfitting. Also understand data leakage, appropriate evaluation metrics and the importance of comparing a model against a sensible baseline.
For a sales forecasting task, for example, randomly mixing future observations into training data can create an unrealistic evaluation. A chronological split is generally more appropriate when the goal is to predict future periods.
At this stage, the objective is not to build the most complicated model. It is to learn how to formulate a question, prepare data, choose an appropriate method and evaluate the result honestly.
5. Your Practical 60-Day Learning Roadmap
A structured plan can help you make progress without trying to learn every data and AI technology at the same time. The following roadmap assumes consistent practice alongside other responsibilities. Adjust the pace based on your starting level and available study hours.
Days 1–10: Python essentials
Learn variables, data types, conditions, loops and functions.
Practice working with lists, dictionaries and files.
Read a CSV file and perform basic calculations.
Write small scripts that reproduce calculations you normally perform in Excel.
Milestone: Create a Python script that reads a small sales dataset and calculates total sales, average sales and the highest-selling product.
Days 11–20: Data analysis with pandas
Load CSV and Excel files into DataFrames.
Inspect data types, missing values and duplicate rows.
Filter, sort, group and combine datasets.
Practice selecting columns and creating calculated fields.
Milestone: Clean a messy spreadsheet and produce a consistent, analysis-ready dataset.
Days 21–30: Visualization and exploratory analysis
Learn basic plotting with Matplotlib and Seaborn.
Create charts for trends, category comparisons and distributions.
Calculate summary statistics and investigate unusual values.
Write short explanations of the patterns you find.
Milestone: Prepare a notebook with at least four useful visualizations and evidence-based observations.
Days 31–40: Machine learning fundamentals
Understand regression, classification and clustering.
Learn training data, test data and baseline models.
Train a simple regression model with scikit-learn.
Evaluate predictions using suitable metrics.
Milestone: Train and evaluate a basic model, then explain its limitations without overstating its accuracy.
Days 41–50: Build one complete portfolio project
Choose a dataset with a clear business question.
Document the data-cleaning process.
Perform exploratory analysis and create visualizations.
Build a simple, appropriate predictive baseline if the data supports it.
Record the evaluation method, results and limitations.
Milestone: Complete a project that another person can run and understand using your instructions.
Days 51–60: Polish and present your work
Organize your code and remove unnecessary steps.
Write a clear README explaining the problem and approach.
Add charts, key findings and evaluation results.
Document assumptions, limitations and possible improvements.
Practice explaining the project as if presenting it to a hiring manager.
Milestone: Publish a clean portfolio project and prepare a short demonstration of what you learned.
By Day 60, the aim is to have a working foundation and one well-documented project—not to claim expertise in every area of AI. Your progress will depend on your previous experience, practice time and the complexity of the work you choose.
6. Build One Portfolio Project: Sales Analysis and Prediction System
A strong beginner project should connect data preparation, analysis, visualization and a clearly defined business question. A sales analysis and prediction system is a practical option because it builds on the kind of information many spreadsheet users already understand.
Step 1: Define the question
Start with a question such as: Which products and regions contribute most to sales, how has performance changed over time, and can historical data support a reasonable estimate of future sales?
Find a public dataset that includes relevant fields such as order dates, product categories, quantities, prices, regions and sales amounts. Review the dataset's license and documentation before using it.
Step 2: Clean and prepare the data
Use pandas to inspect column names and data types, handle missing values, identify duplicates and verify calculations. Check whether the sales amount is already provided or must be calculated from quantity and price. Document important decisions rather than silently deleting inconvenient records.
Step 3: Explore and visualize
Analyze sales by month, region and product category. Create charts that answer specific questions, such as whether performance is seasonal or whether a small number of categories account for a large share of revenue.
Step 4: Establish a prediction baseline
If the dataset contains enough reliable time-based information, build a simple forecasting baseline. Compare it with a suitable alternative and evaluate it on a later time period that was not used for training. Choose an appropriate metric, such as mean absolute error, and explain what the result means in the original business context.
Do not assume that a more complex model is automatically better. If the dataset is too small, inconsistent or unsuitable for forecasting, present the analytical findings and explain why reliable prediction is not yet justified.
Step 5: Present the results
Organize your project with a clear folder structure, readable code and a README. Include the business question, dataset source, preparation steps, charts, modelling approach, evaluation results and limitations. Where appropriate, add a small dashboard or a reproducible notebook.
Your portfolio should demonstrate how you think, not merely that you can execute code. A well-explained project with sensible evaluation is more informative than a complicated model with no clear purpose.
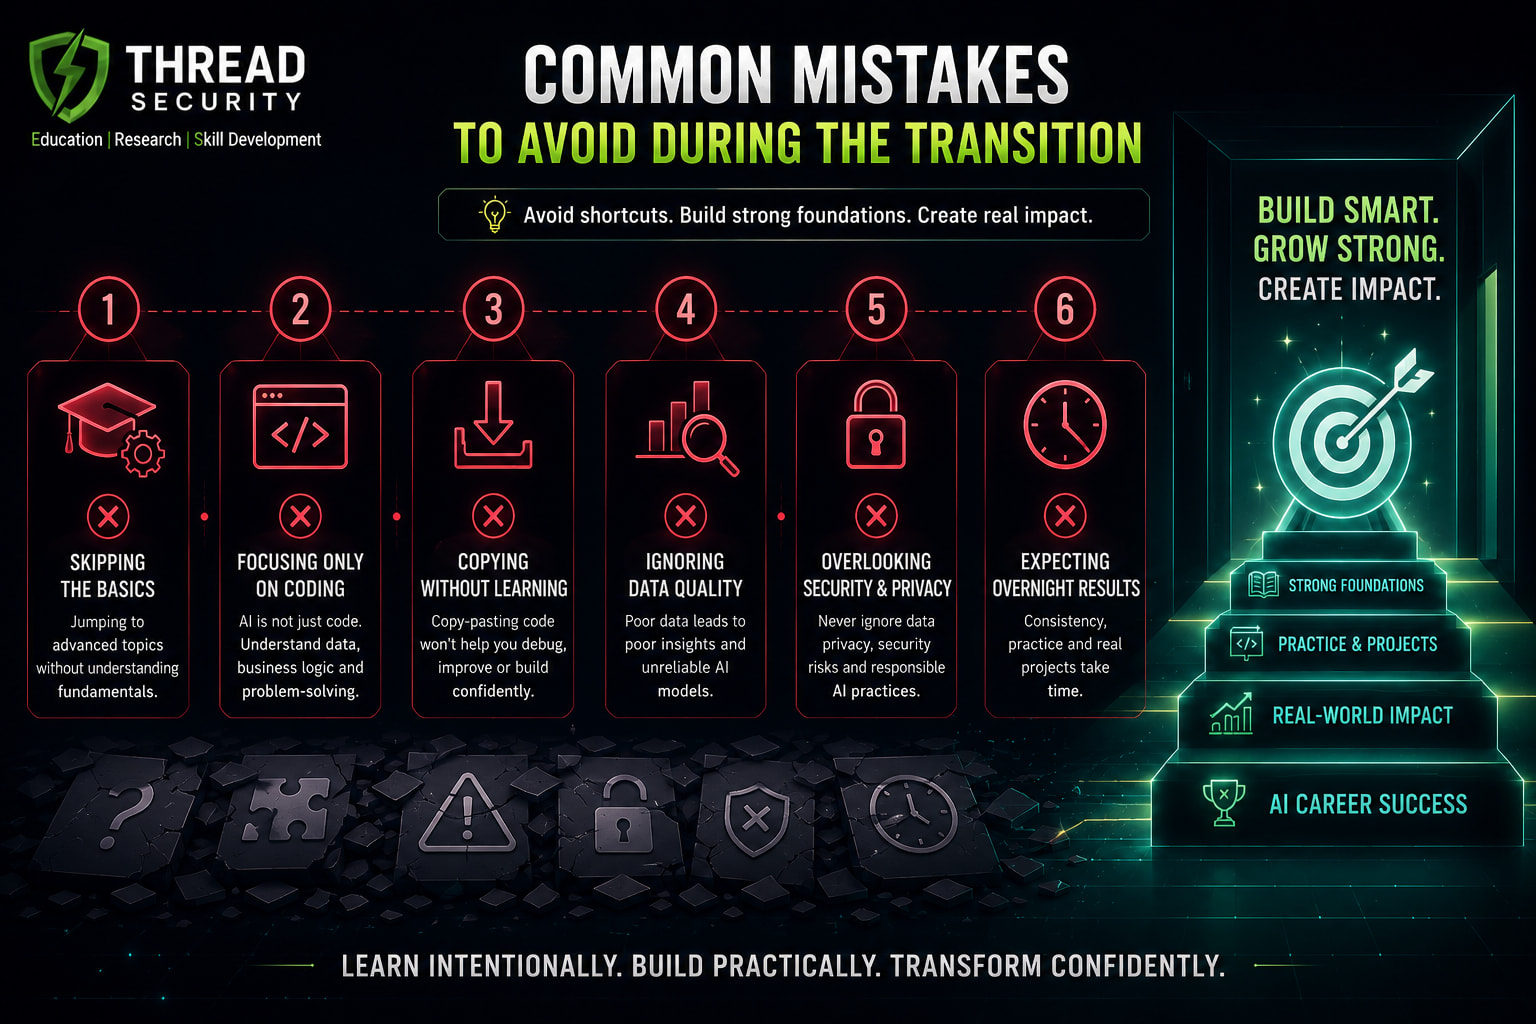
7. Common Mistakes to Avoid During the Transition
Trying to learn every AI tool at once
Python, pandas, visualization and basic machine learning provide a more coherent starting path than jumping between many unrelated tools. Add new technologies when they solve a problem you understand.
Watching tutorials without practicing
Following a tutorial can help you learn a technique, but you should also apply it to a different dataset. Change the question, investigate an unexpected result and explain your decisions. Independent practice reveals whether you can transfer what you learned.
Ignoring data quality
Machine learning does not automatically fix missing values, inconsistent categories or incorrect assumptions. Data preparation and validation should remain part of every project.
Putting AI on your résumé without evidence
Instead of listing a long collection of technologies you have briefly explored, demonstrate what you can do with a project. Be ready to explain your contribution, the decisions you made, the metrics you used and what you would improve.
Assuming a 60-day plan guarantees a job
A roadmap creates structure, but it cannot guarantee employment or a particular salary. Job requirements vary by role, organization and experience level. Use the roadmap to build skills and evidence, then compare your portfolio with current job descriptions to identify the next gaps to address.
8. What Career Opportunities Can This Path Open Up?
Combining business-oriented data analysis with Python and machine learning can help you prepare for several related career paths. The best fit depends on your skills, project experience and the requirements of individual employers.
Data Analyst: Analyze business data, build reports and communicate findings.
Python Data Analyst: Automate data preparation and analysis workflows using Python libraries.
Business Intelligence Analyst: Support business decisions through reporting, metrics and dashboards.
Junior Machine Learning Practitioner: Contribute to data preparation, baseline modelling and evaluation under appropriate guidance.
AI or Data Science Trainee: Develop analytical and modelling skills through structured projects and supervised work.
These roles overlap, but they are not interchangeable. Many AI engineering and data science positions require deeper knowledge of statistics, software engineering, deployment, model evaluation and domain-specific problem-solving. Continue building those capabilities as your interests develop.
When reviewing job descriptions, look for recurring requirements and compare them with your current skills. This will help you decide whether to deepen your analytics expertise, progress into machine learning or explore another specialization.
9. Where to Learn and Practice
You can begin with official documentation and hands-on learning resources rather than immediately paying for multiple courses. Use documentation to understand how a tool works, and use projects to turn that knowledge into practical ability.
Python: Official Python Tutorial
pandas: Getting Started with pandas
Matplotlib: Matplotlib Tutorials
Seaborn: Seaborn Tutorial
scikit-learn: Getting Started with Machine Learning
Choose one primary learning resource at a time. Follow it with a practical task, record what you learned and maintain a portfolio of projects that become progressively more challenging.
10. Start Your Data Analyst to AI Journey with a Practical Plan
The transition from spreadsheets to AI is not a single leap. It is a series of achievable steps: use Python to automate familiar calculations, apply pandas to structured data, visualize patterns, learn the fundamentals of machine learning and demonstrate your progress through a meaningful project.
If you are exploring AI courses in Jalandhar, look for learning opportunities that combine programming, data handling, guided practice and project development. A course should help you understand why a technique works, when to use it and how to evaluate the results not just show you which buttons to click.
Thread Security Education focuses on practical, career-oriented technology learning. Explore the available learning opportunities, identify the skills you want to develop and choose a path that matches your current experience and goals.
Visit Thread Security to learn more about Thread Security and its technology-focused initiatives.
Your first step does not need to be a complex AI model. Start with a spreadsheet you already understand, reproduce one useful analysis in Python, and build from there. Consistent practice and a portfolio of honest, well-explained work can help you move towards more advanced data and AI responsibilities.
Simranjit Kaur
VERIFIEDAI Trainer · Thread Security
Faculty mentor & research guide at Thread Security Education.